Workshop: Making it stick 3 – Impactful Reporting with Data Visualisation and Dashboards(Online 22 & 23 May 2024)
Title: Making it Stick 3 – Impactful Reporting with Data Visualisation and Dashboards
Date and time: Wednesday 22 May and Thursday 23 May 9.30am - 1.00pm AEST (registration from 9.15am) Registrants are to attend both sessions. (full day workshop - 2 sessions)
Venue: Via Zoom. Details will be emailed to registrants just prior to the workshop start time
Facilitator: Dr. Samantha Abbato
Register online by: Tuesday 21 May 2024. Spaces limited to 25 participants.
Fees (GST inclusive): Members $295, Organisational member staff $415, Non-members $485, Student member $140, Student non-member $226. Students must send proof of their full-time student status to
Workshop Overview
Most evaluation reporting incorporates quantitative data. This data can be challenging to communicate and understand for many evaluators, stakeholders, and potential users of evaluation reports. Ironically, the more quantitative data we access for reporting, the harder it seems to be to communicate it. Common mistakes in reporting data include presenting too much data, too little context, meaningless variety and overdecorating.
Impactful use of data visualisations and strategically combining them into data dashboards or data summaries can make quantitative evaluation findings easier to engage with, understand and use. This workshop aims to introduce principles and tools from various fields, including graphic design, psychology, communication, and storytelling, to increase the power of quantitative data through simplicity and clarity rather than superficial flash and sizzle.
This workshop brings a purpose and audience-focused, visual storytelling approach to communicating and reporting quantitative evaluation data. It is for professionals who need to share quantitative or mixed-method evaluation findings and want to do so with greater effect in data dashboards, data summaries, evaluation reports and presentations. Workshop participants will be guided through practical activities to identify the stories in their data, choose appropriate and effective visual displays, focus attention, and design for maximum engagement and communication.
Workshop Content
This workshop is interactive and involves sharing experiences and hands-on activities. We will provide a brief refresher on identifying key messages and understanding stakeholders from Stick 1 and infographic storytelling and design from Stick 2. Using real-life examples and case studies, we introduce the building blocks of evaluation data visualisation (graphs). Participants will gain practical experience choosing visual displays that match their message and using communication and design principles to adjust the visual for maximum effect. A brief introduction to planning data dashboards will provide a pathway for combining visuals into a complete visual story for evaluation data reporting.
Participants will be provided opportunities to apply new skills to their work during and between the workshop Zoom sessions. Participants will be able to practice storytelling with data through presentations.
Four main areas will be covered.
1. Basic introduction to data visuals and dashboards: A brief overview of data visualisation options, platforms and software will be provided. Current examples of the good, the bad and the pitfalls to avoid when creating data dashboards will be presented. Principles for impactful communication and use of data visual reports will be reviewed. Participants will be able to plan a dashboard appropriately for priority evaluation users using key messages, effective structuring and design strategies.
2. Building blocks of data visualisation: Practical examples and case studies of the most impactful graphs and other data visuals are provided. Learn how to assess a graph based on its visual power. Know the popular graphs that are poor choices because of their inability to communicate clearly and effectively. Apply a checklist and steps for choosing compelling visuals based on the communication purpose, stakeholder, and key message.
3. Building visual power: Easy-to-apply strategies and tools will guide participants in building the strength of their visuals. Using principles of graphic design, visual perception and practical strategies for increasing focus and decreasing clutter, participants will come away with tools they can instantly apply to improve their data visuals.
4. Visually communicating the whole data story: Learning to apply storytelling tools will help you combine the building blocks in a complete visual story of your data. The rigour of evidence and what needs to be added to provide a comprehensive picture will be covered. Finally, we offer a step-wise approach to creating and testing an impactful data dashboard with intended users.
What are the learning outcomes / objectives of the workshop?
This workshop is for evaluators and other professionals who would like to:
-
Increase their familiarity with data visualisation platforms and options;
-
Plan a data dashboard for evaluation stakeholders using communication and utilisation-focused principles and storytelling tools and techniques;
-
Identify appropriate graphs or other visuals for communicating a quantitative evaluation finding;
-
Improve the effectiveness of graphs and visuals through good design, visual perception, and communication principles;
Gain knowledge and skills in telling compelling stories of evaluation data with effective visuals.
PL competencies
This workshop aligns with the AES Evaluator’s Professional Learning Competency Framework competencies. The identified domains are:
-
Domain 1 – Evaluative attitude and professional practice
-
Domain 3 – Culture, stakeholders, and context
-
Domain 4 – Research methods and systematic inquiry
-
Domain 5 – Project management
-
Domain 6 – Interpersonal skills
-
Domain 7 – Evaluation activities
Who should attend?
This workshop is designed for professionals who need to communicate evaluation data. It is an ideal follow-on workshop for people who have completed ‘Making it Stick 1 – Crafting an Evaluation Report for Impact and Use’ and a companion to ‘Making it Stick 2—Visual Reporting with Posters and Infographics’. However, it is not essential that participants attend Stick 1 or Stick 2.
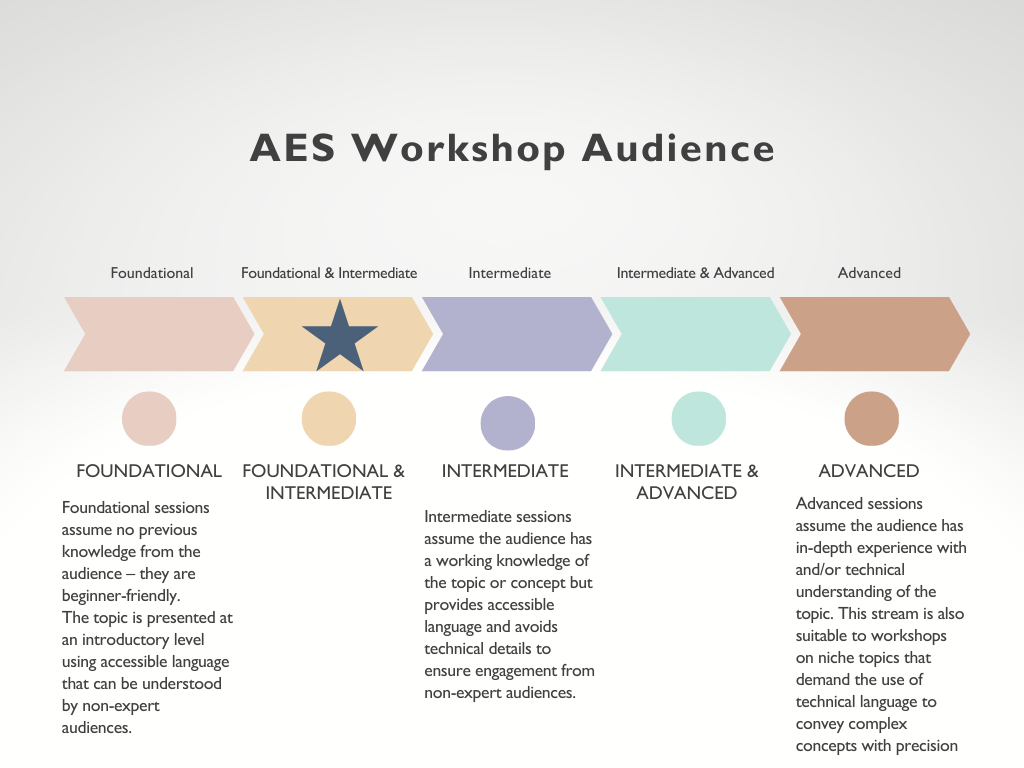
It will benefit evaluators and other professionals at an introductory to intermediate level of crafting evaluation reports that include quantitative data. It is for those who understand the power of simplicity and clarity over the superficial flash and sizzle of the latest data craze and software.
Workshop start times
-
VIC, QLD, NSW, ACT, TAS: 9.30am
-
SA, NT: 9.00am
-
WA: 7.30am
-
New Zealand: 11.30am
-
For other time zones please go to https://www.timeanddate.com/worldclock/converter.htm
About the facilitator
Dr. Samantha Abbato is the director of a transdisciplinary consortium of professionals, including a videographer, a graphic designer, a systems thinker, and a virtual reality practitioner. Over the last six years, the facilitator has successfully experimented with these other disciplines to un-box evaluation reporting. She has had considerable experience crafting evaluation reports using these multi-disciplinary tools across several sectors. She regularly facilitates workshops for AES professional development and for community and health sector clients, including in mixed-methods (AES 2019), report crafting (AES 2017,2018, 2020), and systems thinking for evaluation (Melbourne AES 2015).
With a passion for communication, maximising evaluation use, and a transdisciplinary approach to evaluation, the facilitator offers a wealth of case studies for increasing the impact of evaluation reporting using data visualisation and story. She has extensive training and experience in quantitative data methods, including a Masters of Epidemiology/Biostatistics, a PhD in Epidemiology, and numerous publications of data-based research and evaluation projects. Her most recent evaluation work includes evaluation and M&E reporting using systems thinking, videography, graphic communication, design thinking, and virtual reality. In addition, the facilitator has completed more than 100 evaluation and research reports and papers for a range of government, non-government organisations, and community stakeholders, including several peer-reviewed publications in 2018 incorporating transdisciplinary approaches.
Event Information
| Event Date | 22 May 2024 9:30am |
| Event End Date | 23 May 2024 1:00pm |
| Cut Off Date | 21 May 2024 4:00pm |
| Location | Zoom |
| Categories | Online Workshops |
We acknowledge the Australian Aboriginal and Torres Strait Islander peoples of this nation. We acknowledge the Traditional Custodians of the lands in which we conduct our business. We pay our respects to ancestors and Elders, past and present. We are committed to honouring Australian Aboriginal and Torres Strait Islander peoples’ unique cultural and spiritual relationships to the land, waters and seas and their rich contribution to society.